TL;DR
In this project, I set out to build an event-driven anti-fraud platform that not only works, but is also operable when things get complicated.
The pipeline uses stage-level intermediate persistence: Outbox in transaction-service, Inbox + Outbox in fraud-detection-service, and Inbox + deduplication in alert-service. With that design, every critical hop (persistence, evaluation, publishing, and alerting) keeps recoverable state without blocking the request path.
The local runtime keeps default x6 replicas per microservice behind NGINX gateways, Kafka runs as a 3-broker cluster, and the scripts/start-autoscale.sh starter computes partitions, listener concurrency, and connection pools to scale coherently.
This is not just a functional demo: it is a case study with explicit resilience, end-to-end traceability, and reproducible validation (unit + integration + e2e + load with k6).
Context and motivation
When fraud analysis and transactional writes live in the same synchronous flow, they compete for latency and availability.
The practical goal was to decouple anti-fraud analysis without losing operational control, with concrete pieces to operate better under real failures:
- consistency between DB and event publishing (Outbox),
- decoupling consumption/processing with Inbox to absorb spikes,
at-least-oncesemantics with idempotent consumers,- DLQ as an operational mechanism (not just a “parking lot”),
- business-oriented observability, not only infrastructure observability.
Technical objective
The technical focus is for the pipeline to work under pressure without losing control:
- Keep high transaction write throughput.
- Close the DB/Kafka consistency gap in
transaction-serviceandfraud-detection-service. - Scale processing with real partitioning, replicas, and Inbox workers.
- Improve triage with traces, structured logs, and stage-level metrics.
- Validate behavior reproducibly with mixed load and failure scenarios.
Implemented architecture
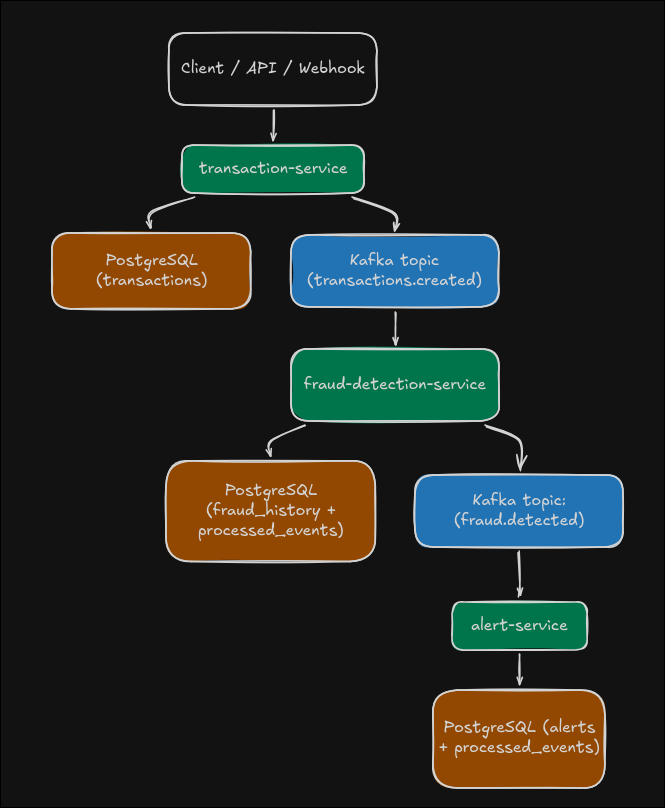
The architecture is organized into three functional domains with a load-balanced entry layer and operational persistence per stage:
transaction-gateway(NGINX :8080) ->transaction-service(defaultx6).fraud-gateway(NGINX :8081) ->fraud-detection-service(defaultx6).alert-gateway(NGINX :8082) ->alert-service(defaultx6).
Services by responsibility:
-
transaction-service- exposes REST API + webhook,
- persists the transaction,
- enqueues
TransactionCreatedEventintransaction_outboxwithin the same DB transaction, - an asynchronous relay publishes to Kafka and marks published/failed states.
-
fraud-detection-service- consumes
transactions.created, - ingests into
fraud_inboxwith idempotent insert byeventId, - processes the inbox with workers, evaluates heuristic rules, and persists history,
- enqueues
FraudDetectedEventinfraud_outboxwhenriskScoreexceeds threshold, - publishes
fraud.detectedthrough an asynchronous outbox relay.
- consumes
-
alert-service- consumes
fraud.detected, - ingests into
alert_inboxand processes with workers, - deduplicates by
eventId(inbox +processed_events) and persists alerts, - notifies by channels (log always enabled + optional email with MailHog locally),
- exposes alert queries for verification and triage.
- consumes
Each service keeps its own dedicated PostgreSQL database and stage-specific operational tables (transaction_outbox, fraud_inbox, fraud_outbox, alert_inbox, processed_events) to decouple stages and sustain recovery.
Kafka topology and scalability
The local stack starts a 3-broker Kafka cluster (kafka, kafka-2, kafka-3) with settings oriented toward local fault tolerance:
min.insync.replicas=2- default replication factor
3 - configurable topic partitions (
APP_KAFKA_PARTITIONS, default18)
Main topics:
transactions.createdfraud.detectedtransactions.created.dlqfraud.detected.dlq
This combination makes it possible to test real partition-level parallelism and better observe lag/backpressure behavior under sustained load.
In addition, the scripts/start-autoscale.sh starter computes a coherent scaling configuration:
partitions = max(fraud_instances * fraud_concurrency, alert_instances * alert_concurrency),SPRING_KAFKA_LISTENER_CONCURRENCYper instance infraud-detection-serviceandalert-service,- effective consumer group concurrency as
min(partitions, instances * concurrency), - Hikari connection budgets/pools per service,
.env.scalingfile to rundocker composewithout editing the base compose.
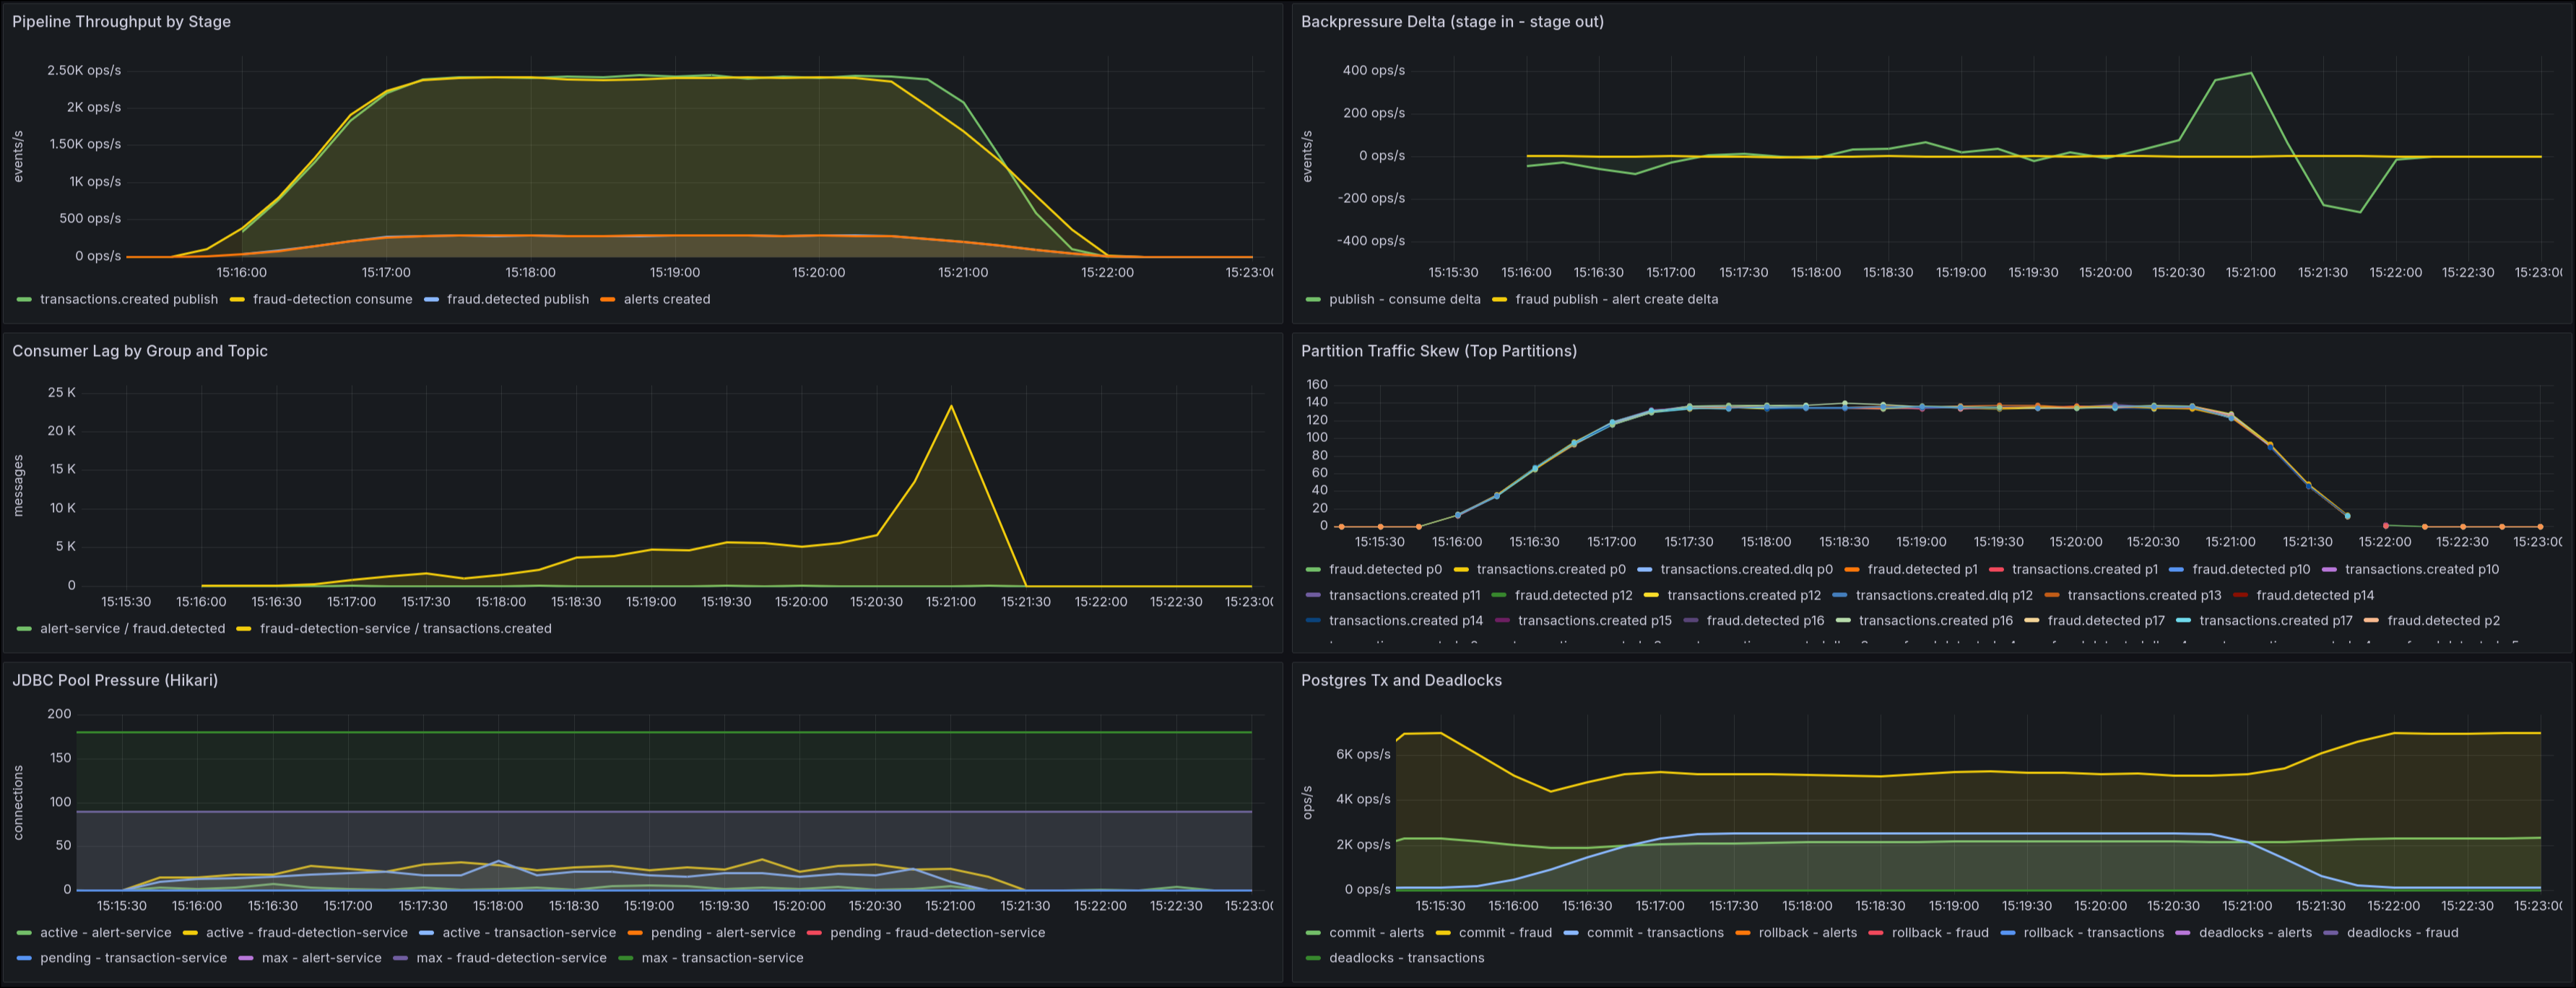
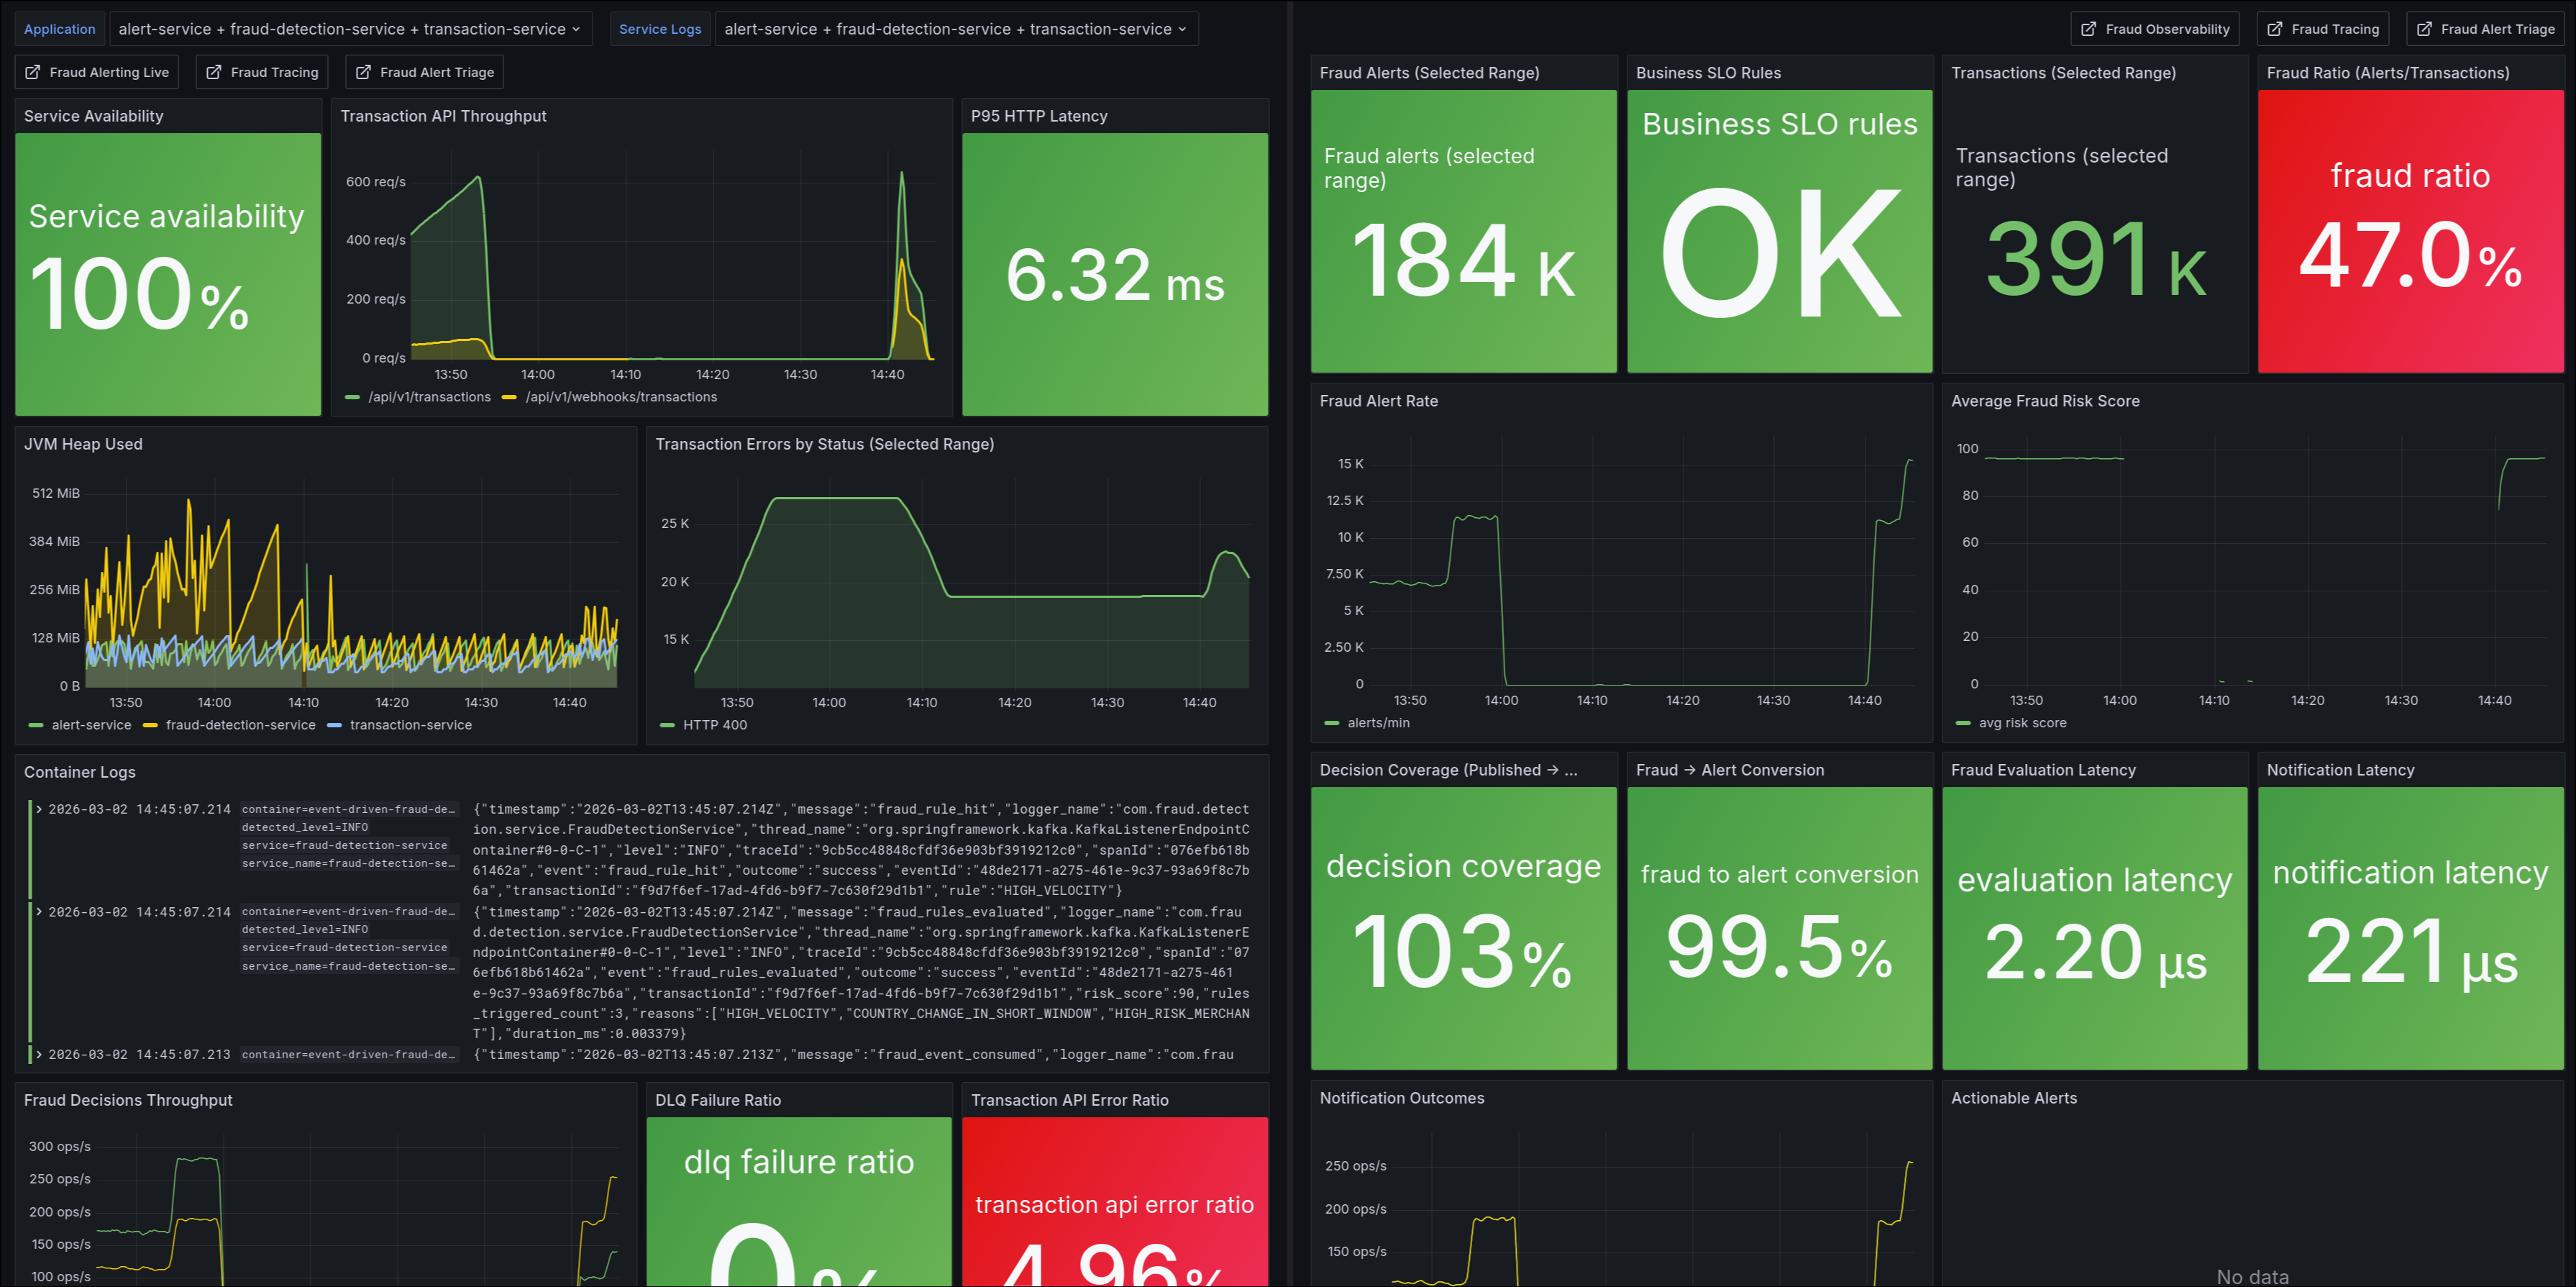
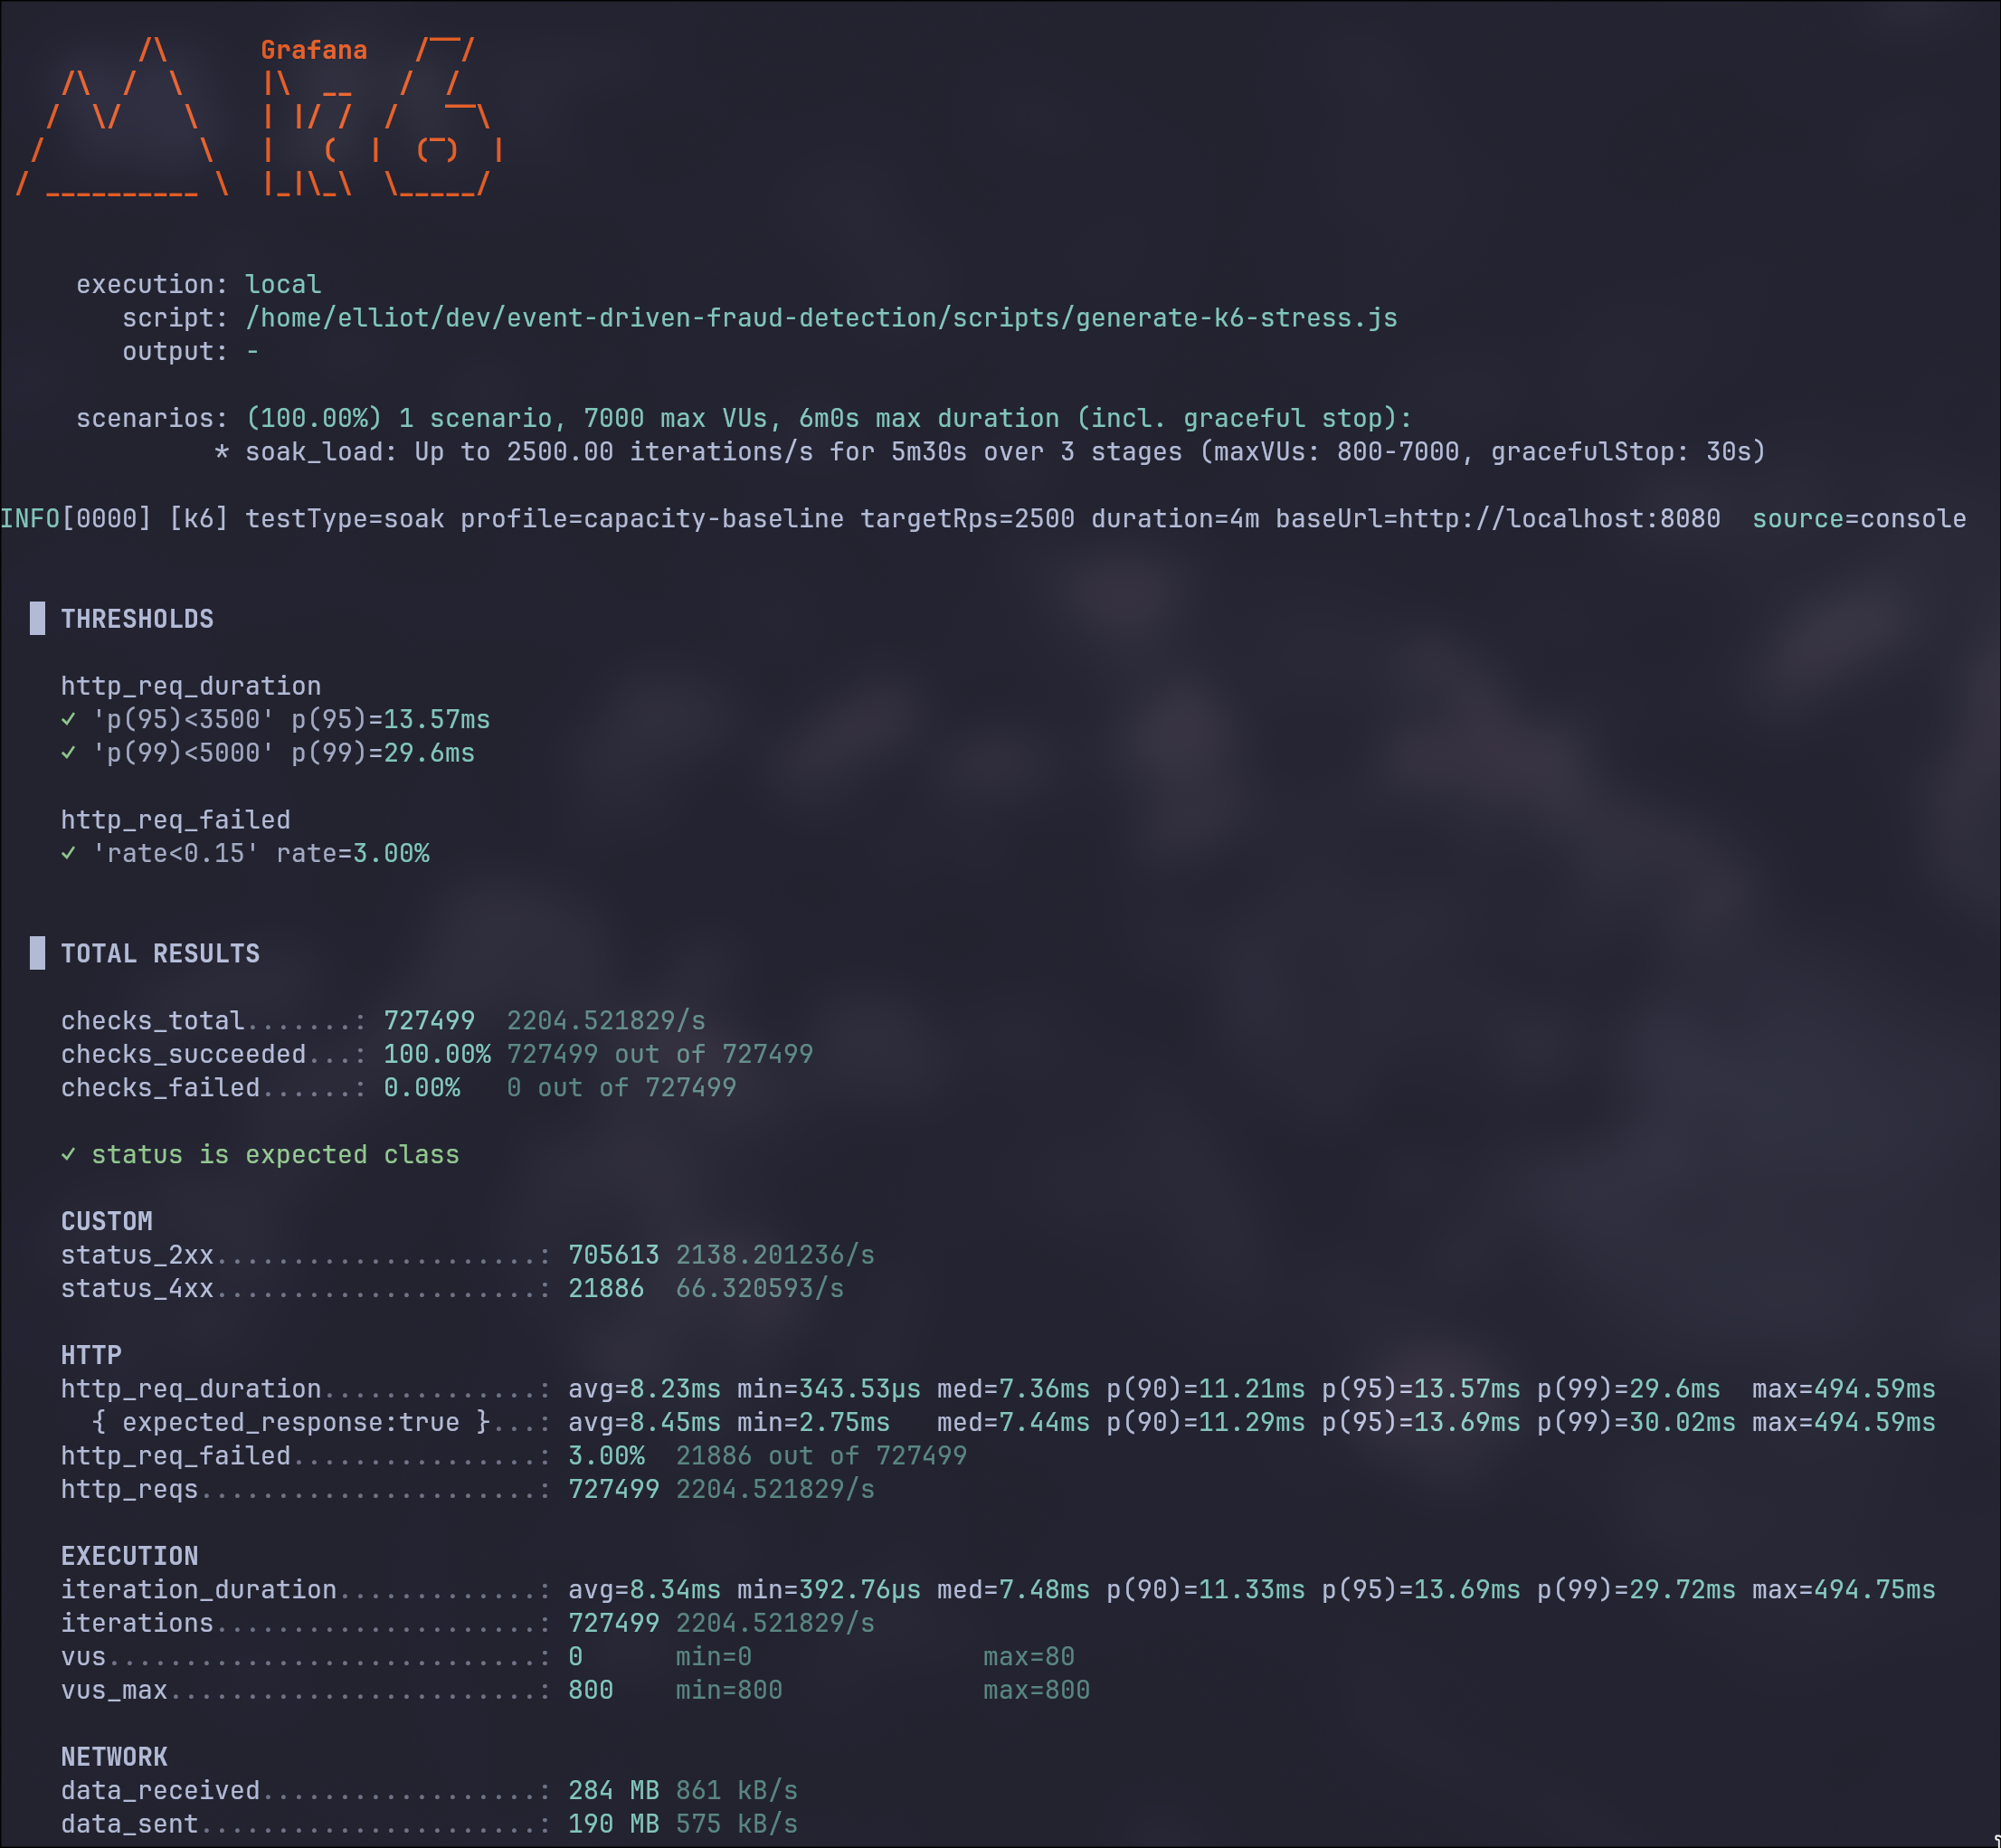
Metrics after sustained load of 2500 RPS with 18 partitions
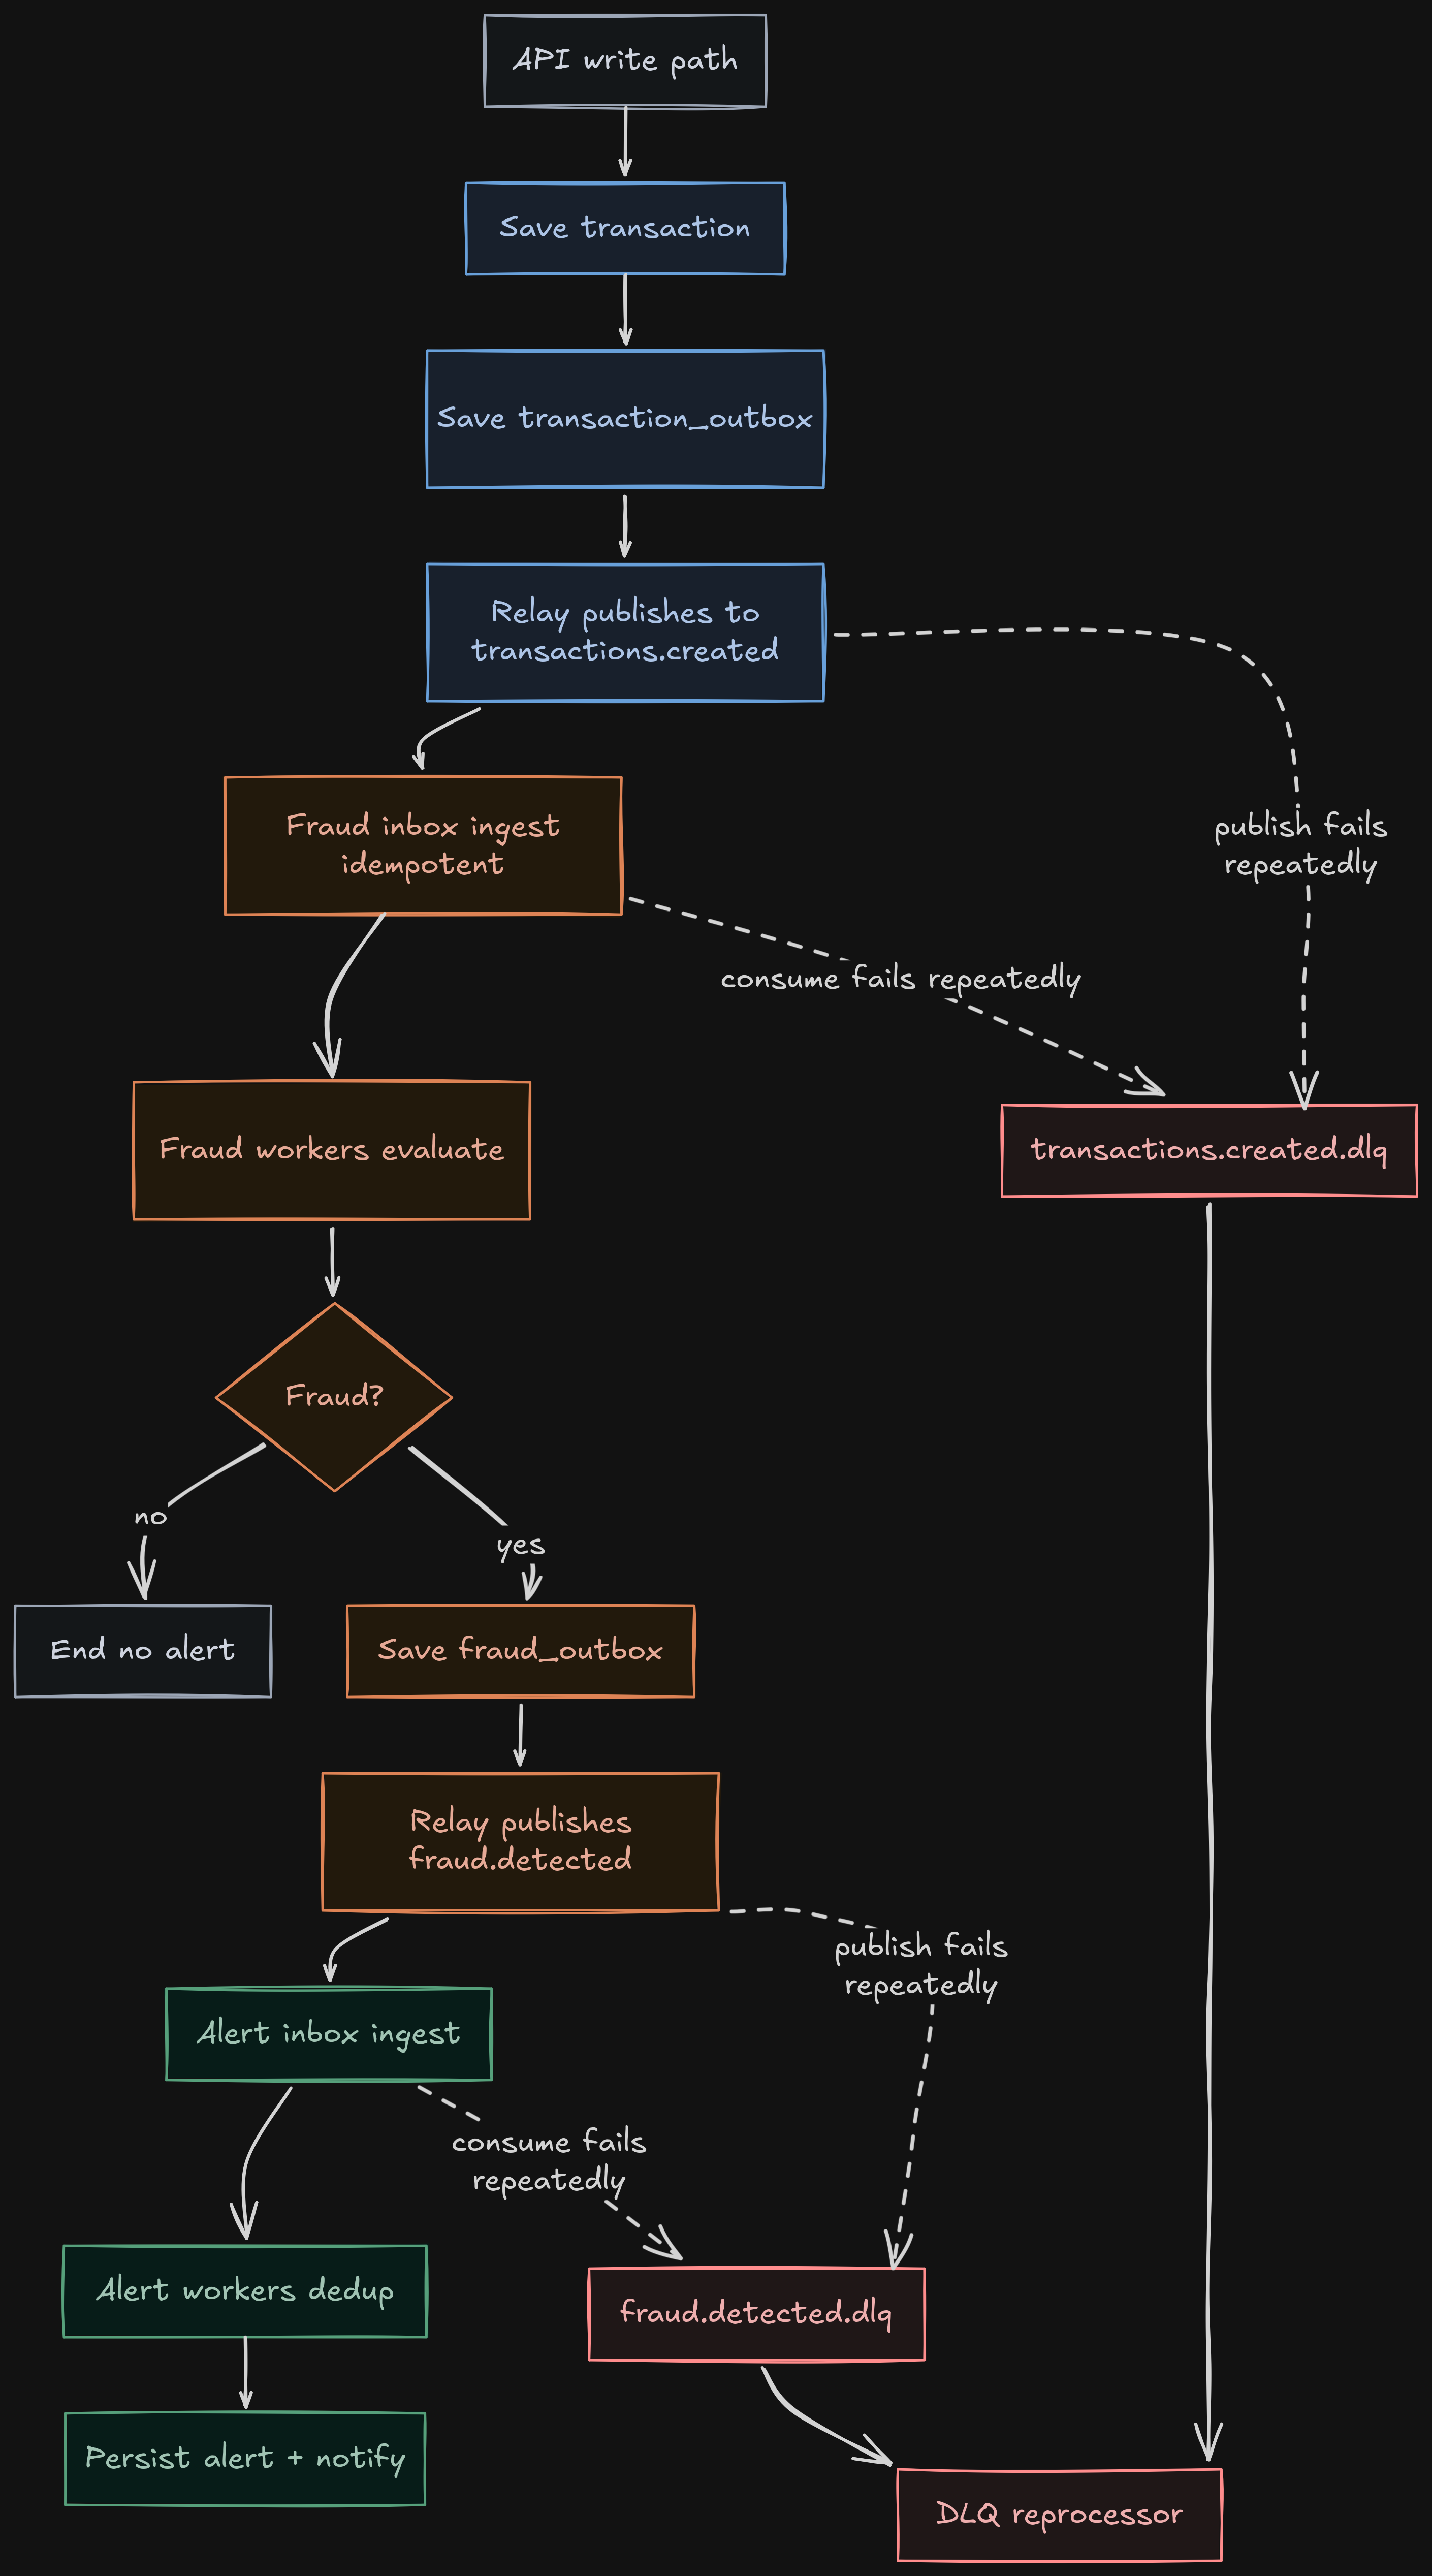
End-to-end operational flow
- Client sends a transaction by REST or webhook to the gateway.
transaction-servicevalidates payload, persists to PostgreSQL, and enqueues event intransaction_outbox(JSONB).TransactionOutboxRelayServicetakes pending batches withFOR UPDATE SKIP LOCKED, publishes to Kafka, and marks state (PUBLISHEDor retry withnextAttemptAt).fraud-detection-serviceconsumestransactions.createdand enqueues intofraud_inboxwithinsert ... on conflict do nothing.FraudInboxProcessingServicedrains inbox with workers, evaluates rules, and persists user transaction history.- If the result is
fraud, it enqueuesFraudDetectedEventinfraud_outbox; its relay then publishes tofraud.detected. alert-serviceconsumesfraud.detected, enqueues intoalert_inbox, and processes with workers.AlertProcessingServicededuplicates (inbox +processed_events), persists alert, and executes channel notifications.- If consumption fails, fixed-backoff retries are applied and then DLQ; DLQ consumers attempt reprocessing and register success/failure metrics.
The separation between synchronous writes and asynchronous processing/publishing per stage is key to keeping stable latency and operational consistency.
Resilience and consistency
Inbox + Outbox per stage
The platform uses intermediate persistence at each critical hop:
transaction-service:transaction_outboxto decouple transactional writes andtransactions.createdpublishing,fraud-detection-service:fraud_inboxfor durable consumption +fraud_outboxfor durablefraud.detectedpublishing,alert-service:alert_inboxto decouple Kafka consumption and alert/notification processing.
Common technical points:
- batching + non-blocking pessimistic lock (
SKIP LOCKED), - retries with configurable delay,
- periodic cleanup of processed/published events,
traceparentandbaggagepropagation to preserve trace continuity.
Concurrent idempotency
Idempotency is applied per layer to sustain at-least-once without duplicate side effects:
fraud-detection-service: deduplication by uniqueeventIdkey infraud_inbox+ explicitRECEIVED -> PROCESSEDstate transition,alert-service: deduplication inalert_inboxand an additional barrier inprocessed_eventswith atomic insert (saveAndFlush) andDataIntegrityViolationExceptionhandling.
Retries, DLQ, and operational reprocessing
The consumption strategy uses fixed backoff (1s, 3 attempts). If recovery does not happen, the message is routed to <topic>.dlq.
The DLQ is not left passive:
- dedicated consumers exist per DLQ,
received/reprocessed/failedmetrics are recorded,- scripts are available to force and verify failure/reprocessing (
scripts/test-dlq.sh,scripts/test-dlq-reprocess.sh).
Rules engine and event contracts
Active fraud rules
An accumulative heuristic engine is used with score cap at 100 and configurable threshold (fraud-score-threshold, default 70).
Active rules:
HIGH_AMOUNT(+45)HIGH_VELOCITY(+35)COUNTRY_CHANGE_IN_SHORT_WINDOW(+30)HIGH_RISK_MERCHANT(+25)
The FraudDetectedEvent includes ruleVersion and transactionOccurredAt, which makes decision traceability and real end-to-end pipeline latency measurement easier.
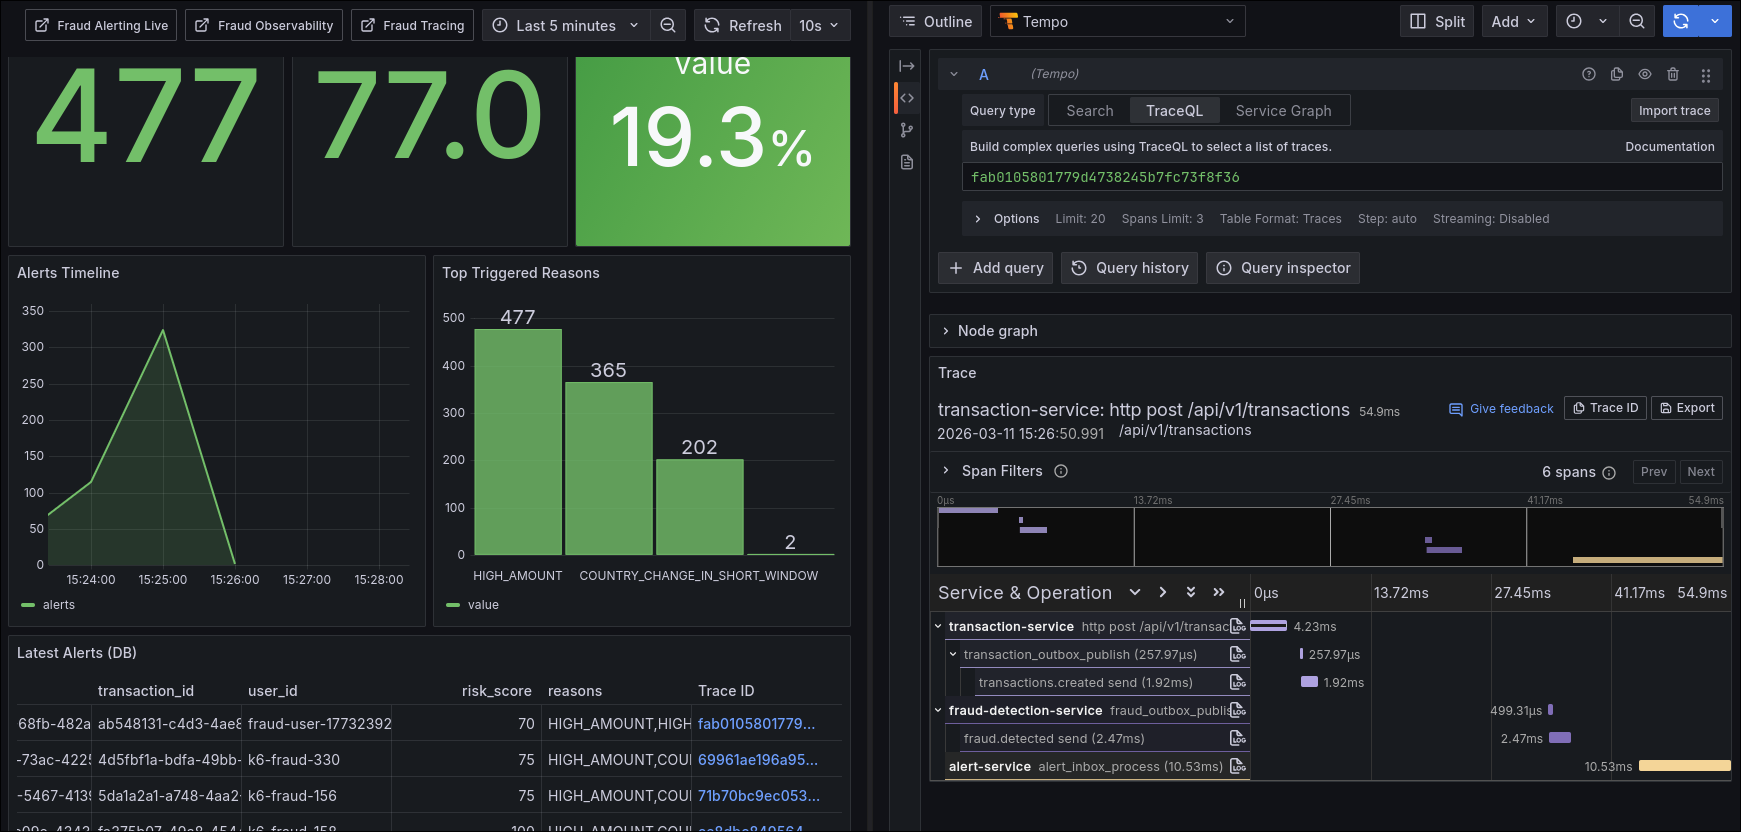
Operational observability
The observability stack covers application metrics, infrastructure metrics, and distributed traceability:
- Prometheus (services + exporters)
- Loki (structured logs)
- Alloy (Docker log collection + OTLP reception)
- Tempo (distributed traces)
- Grafana (dashboards and exploration)
- Kafka Exporter + Postgres Exporters + cAdvisor (capacity and infrastructure)
- operational JSON log contract (
event+outcome) to filter critical transitions by service.
Active dashboards:
fraud-observabilityfraud-alerting-livefraud-tracingfraud-alert-triage-dbfraud-kafka-operationsfraud-throughput-livefraud-capacity-backpressure
Metrics that delivered the most value
transaction_events_enqueued_total{outcome}transaction_events_published_total{outcome}fraud_events_consumed_totalfraud_events_published_total{outcome}fraud_decisions_total{decision}fraud_alerts_totalfraud_alert_notifications_total{channel,outcome}fraud_pipeline_e2e_latency_seconds{path}fraud_inbox_backlogalert_inbox_backlogkafka_dlq_events_received_totalkafka_dlq_events_reprocessed_totalkafka_dlq_events_failed_total
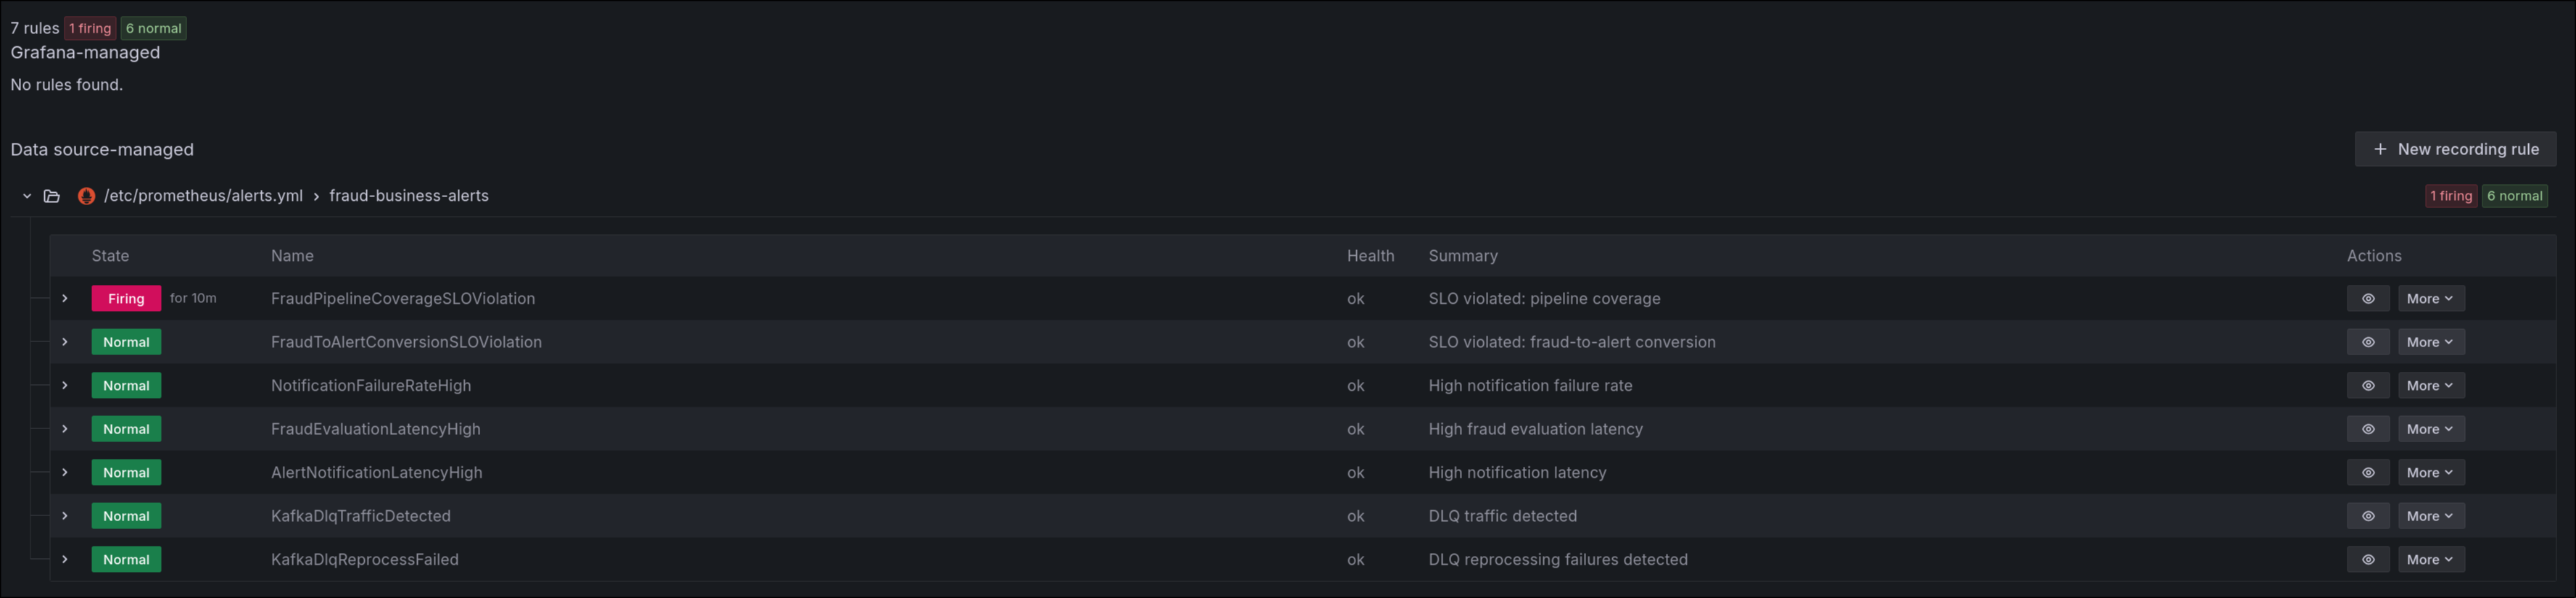
Business and reliability alerts
Business and reliability rules were included (including coverage and conversion SLOs):
FraudPipelineCoverageSLOViolationFraudToAlertConversionSLOViolationNotificationFailureRateHighFraudEvaluationLatencyHighAlertNotificationLatencyHighKafkaDlqTrafficDetectedKafkaDlqReprocessFailed
This set reduces detection time and avoids depending only on generic technical alerts.
Behavior validation
Reproducible load with k6
The load runner is prepared for daily use and comparable tests:
- modes:
stress,spike,soak,smoke, - profiles:
capacity-baseline,balanced,mostly-normal,fraud-focus,validation,chaos-5xx,custom, - interactive and non-interactive support,
- strong input validation before execution,
- fallback to
grafana/k6container when no local binary is available.
This makes it possible to test not only throughput, but also controlled degradation, queue pressure, error behavior, and fraud decision consistency.
Automated tests
The strategy combines:
- unit tests,
- per-service integration tests with Testcontainers (Kafka + PostgreSQL),
- full-pipeline e2e with 6 scenarios (including mixed load with error rate, P95, and alert materialization assertions).
There are also separate CI workflows for build/unit, integration, and e2e, with retries in e2e and diagnostic artifacts on failure.
Outcome signals that are actually validated
Beyond “it compiles,” there are explicit conditions the project validates automatically:
- in
mixedLoad_shouldKeepApiHealthyAndGenerateExpectedAlerts(e2e), 120 concurrent requests are executed (REST + webhook), - the test requires
errorRate <= 2%andp95 < 2.5son the entry path, - and it also confirms that the expected fraud volume ends up materialized as persisted alerts.
This does not replace a production benchmark, but it does guarantee a reproducible baseline to compare architecture and tuning changes without subjective “feelings.”
long failedRequests = results.stream().filter(result -> result.statusCode() != 201).count();double errorRate = failedRequests / (double) totalRequests;assertTrue(errorRate <= 0.02, "API error rate should stay below 2% under load");List<Long> latencies = results.stream() .map(LoadResult::latencyMs) .sorted(Comparator.naturalOrder()) .toList();int p95Index = (int) Math.ceil(latencies.size() * 0.95) - 1;long p95LatencyMs = latencies.get(Math.max(0, p95Index));assertTrue(p95LatencyMs < 2500, "P95 latency should stay below 2.5s under load");await() .atMost(Duration.ofSeconds(90)) .pollInterval(Duration.ofSeconds(3)) .untilAsserted(() -> { int currentAlertCount = given() .when() .get(alertServiceUrl + "/api/v1/alerts") .then() .statusCode(200) .extract() .path("size()"); assertTrue(currentAlertCount >= initialAlertCount + fraudulentRequests, "Fraud alerts should be generated for load scenario"); });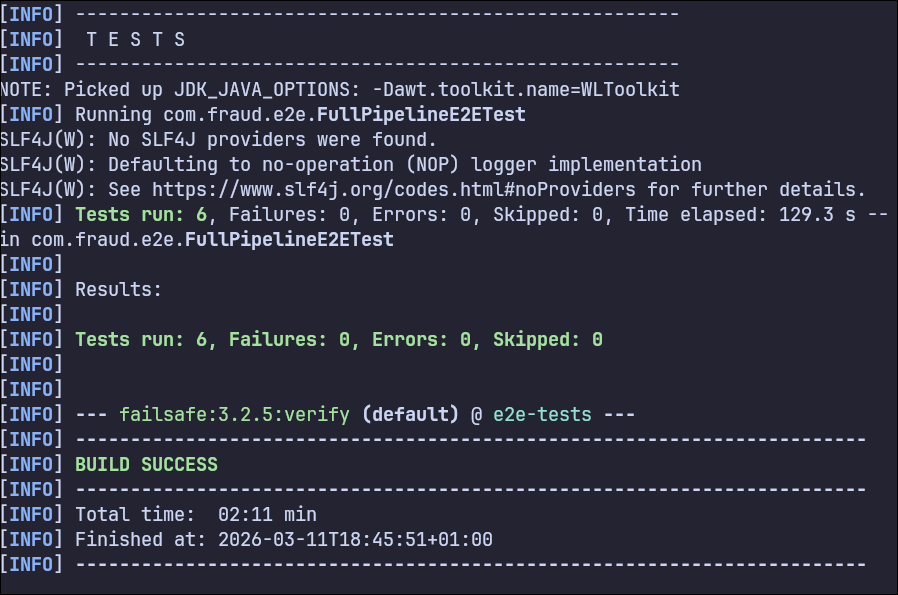
Daily operations and triage
Recommended operational flow:
- Confirm pipeline health on business dashboards.
- Verify whether the bottleneck is inbox backlog, outbox publish, evaluation, or notification.
- Correlate by
traceIdin JSON logs. - Jump to distributed trace for the exact sequence.
Useful scripts from the repository:
scripts/start-autoscale.shscripts/single-fraud-scenario.shscripts/run-k6-stress.shscripts/test-dlq.shscripts/test-dlq-reprocess.sh
Implemented guarantees
The platform includes concrete end-to-end guarantees:
- lower risk of event loss during intermediate failures through stage-level persistence (inbox/outbox),
- isolation between synchronous path (API) and asynchronous evaluation/publishing segments,
- explicit deduplication to neutralize redeliveries and races in consumers,
- operational traceability per event (state, attempts, errors, latency, and backlog).
Assumed trade-offs
There are also deliberate concessions that are part of the design:
- consistency is eventual (not immediate): detection/alert arrives milliseconds or seconds after the initial write,
- operational complexity increases (more state tables, workers, retention policies, and queue metrics),
- observability cost goes up, but it is offset by faster diagnosis during real degradation.
Current technical debt
| Area | Current state | Risk | Next step |
|---|---|---|---|
| Event contracts | JSON without formal governance | Silent incompatible changes | Formal versioning + contract tests in CI |
| DB schema | ddl-auto: update still in use | Drift between environments | Versioned migrations (Flyway/Liquibase) |
| API security | Endpoints without authN/authZ | Operational exposure | JWT/OAuth2 + rate limiting |
| Deployment platform | Focus on local Docker Compose | Gap compared to production | Production profile (orchestration + autoscaling) |
Metric naming fine standardization is also still pending to simplify long-term dashboard maintenance.
Key learnings
- Moving to event-driven without intermediate persistence (Inbox/Outbox) leaves a consistency gap that is too costly in production.
- Consumer idempotency is not optional when you have
at-least-onceand real parallelism. - DLQ without reprocessing and dedicated metrics is operational debt in disguise.
- Observability that actually accelerates triage combines business metrics + structured logs + traces.
- Loading the system with mixed profiles (not only happy path) changes the quality of architecture decisions.
Personal closing
This project left me with a practical conclusion: in event-driven architectures, building a functional flow is only half the work; the other half is making it observable, recoverable, and operable under pressure.
That changed my design criteria: now I prioritize guarantees, operational signals, and recovery strategies from the beginning.